Six Google Analytics tips that make your analysis more powerful and can help you to take data-driven important decisions for your business.
Google Analytics is a free analytics tool for a site which doesn’t have enormous traffic and not requires highly advanced analytics from the website. Though its free version is also bit complex for a marketer because it gives you powerful insights for your site.
Over 28 million websites across the globe using Google Analytics, Google Analytics has lots of potentials to drive creative marketing campaigns. Here we will have a more powerful way to study data and get your website more accessible.
These tips are…
• Find Your Low-Performing Pages
• Set Custom Alerts to Know About the Up and Downs in Real-Time
• Leverage Google Analytics to Inspire Online Content
• Linking Offline Marketing Campaigns to Google Analytics
• Create Filters to make your Google Analytics Data more Accurate:
• Hour and Day Report to analyse what time you have users at your site.
As a marketer, we all have used Google Analytics at some point in our life, and it is a go-to platform for websites around the world.
Google Analytics has been complicated and hard to navigate for the marketers, and it has its reputation as complicated for analytics. To make it easier google has put lots of efforts like customization report options and Google Data Studio for customization data representation as per the users need. We will tell you more about the data studio and report customization in another article. But here, we will discuss some exciting tips to explore google analytics more.
There are many Google analytics tutorials out there that tell you how to analyse the traffic and identify the user behaviour at your website or user interactions on your website. But you should use these metrics and dimensions to make your site more useful for users by implementing actionable insights.
Here are some hidden tips that help you to work in your marketing campaigns.
(1.) Find Your Low-Performing Pages:

Many marketers always focus on high traffic pages and neglect the low-performing pages. It is among the top utility factors of the Google Analytics tool. If you know about the low-performing page than you can reshuffle your planning for those pages, this analytic can help you
- To understand the content ideas aren’t working for your audience and you should have more engaging content and creative on the page
- To identify the poor UI designs or the lack of responsiveness of the low performing pages
Now the question is how you can go about finding the most moderate ranking pages on Google Analytics?
First, you click on the behaviour tab in the main menu and select “Exit Pages” under “Site Content” tab. Now you can see the pages with existing pages percentages with their URLs. Now observe the pages which have a high per cent of exit rate. After identifying this go to the second step, again go to the Behaviour tab in the main menu and select In-Page Analytics option under the Behavior tab. Now you can navigate to the pages to find out accurately which page elements are registering below-par performance
(2.) Set Custom Alerts to Know About the Up and Downs in Real-Time

Daily monitoring Google Analytics is enough to make an accurate picture of the website performance. And daily performance can be predictable enough and so many factors are involved in a single graph, You’re only just about studying the average.
Let’s have an example If Google Analytics reports users from different regions every day. A spike in usage from a specific region will slip under the radar, until and unless you don’t look for data proactively. Here the Intelligence Events come in the picture
Intelligence Events is defined as a specific anomaly from regular website traffic patterns registered by Google Analytics. Like surge in traffic from a particular region and dip due to no campaigning or any other issue in specific traffic are some of the intelligence Events you can look-at. Here you can set up an alert by automated email or SMS that will notify you about the intelligence events in the real-time.
How to setup these Intelligence events
For setting up these intelligence events, you have to have the following steps
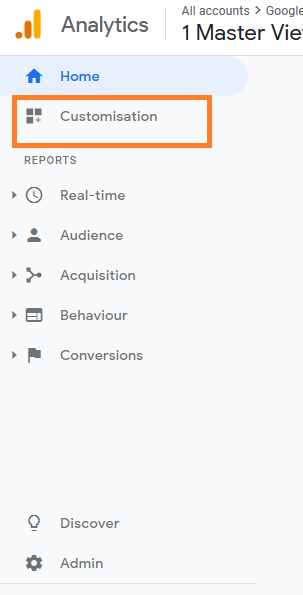
Step-1 Go on the Customization tab on the main menu and click on it
Step-2 Here you see the option Custom Alerts, now click on the Custom Alerts Option and as you click on it

Step-3 Here you have a button “Manage custom alerts” click on it
Step-4 Now click on New Alert and select the time duration for the alert. Email address any other than the registered one, if you want and mobile number if you are from the United States only. These are the notification method available here
Step-5 Now select the parameters which will trigger an Event
Step-6 Click on save button; now your alert is saved
In this way, you can set up an intelligence event and can have multiple alerts to save your time
(3.) Leverage Google Analytics to Inspire Online Content

Content is considered as queen if a user is a king. Now without having post publish analysis, you can’t improve your page and even can’t understand the value of your content on the page. For this, Google Analytics can help you to analyse the content and help you to optimize it. It is not just to identify the top-performing page and replicating it across the site.
Here are the tips that can help you to find data-driven ideas to create user-friendly content.
1. Categorize your content or organize it into a clear bucket like how-to guides, listicles and more. Now analyse which content is receiving more traction and leading to genuine conversion. The more productive pages you can quickly identify. But you should also work on material which is nighter the fruitful nor the very less productive or can say lay between less productive and very much productive. You should work on them.
2. Use the Search Terms report, which is available under the Behaviour tab to find the exact words and phrases users are looking for. It helps to optimize your website in SERPs.
3. Organize or categorize your keywords as you did for content. Is your customer looking for a specific brand? Are they looking for and actionable information? Or are they researching about the product or service before purchasing? Based on your keyword category, you can optimize your site to rank your page in SERPs.
4. Bounce rate is also an important indication to tell you the response towards your content. Average bounce rates across pages show you the fact that it is useful for users or not. And help to improve the page content.
It is important to remember that elements other than just user alignment, content quality, and SEO optimization can fetch high traffic on your website. You should also take note fo outliners such as Images, Vidoe content or GIFs when creating content-oriented Google Analytics reports.
(4.) Linking Offline Marketing Campaigns to Google Analytics

Now it is possible to acquire visibility or identify the traffic in Google Analytics from the non-digital marketing efforts- such as print, TV commercials, radio, and direct mail.
The question is, how we can do this?
Many Google Analytics tutorials don’t tell you how you can track the traffic of any non-digital marketing campaigns. Here you can quickly pinpoint the traffic from any marketing activity and analyse the different marketing activities and their effects. As per their impact, you can allocate or manage your budget, considering profit analysis.
For example, you have given a print ad in a newspaper and have mentioned a QR Code with a Call to action that “scan me” and for this QR Code. You can put URL form UTM Builder (here UTM Builder is for creating URL for custom source and medium) and track data in Google Analytics. You can also use a different site for URL Builder and Short URL Builder and make short URL for the users.
Short URL can be used in any TV commercials, or Radio advertises to track traffic source. These are the ways through you can track any non-digital marketing campaigns into google analytics. There are different other analytics available to identify the cause. But we are discussing Google Analytics; we are telling you about the Google Analytics feature here.
(5.) Create Filters to make your Google Analytics Data more Accurate

When you track traffic in Google Analytics. You find traffic from your office, home, website SEO team, developer and others known sources which may not be your customers. All these traffic types are recorded in google analytics, and this affects your average. This unkonw manipulation may affect your data-driven decision, and due to such biases, your decision may be wrong.
So, you should create filters in Your Google Analytics. There are three levels in google analytics First is Account, second its property, and third is view. Here you have to create filter views. Let’s say you want to track offshore traffic or traffic from a specific country to make your decision. As per the data you collect from the analytic, you should create a filtered view here.
How to create a filtered view here
Step-1 First you should go to the main menu in google analytics and select “Admin” there
Step-2 Now go to create view option and click on it. Put the name of your view like if you want to exclude your city or any ISP address put any name by which you can understand about this view. Also, select the time zone here and click create a view
Step-4 Now your view is created, but you have to add a filter in this view. For this, you should again go in the admin area and select “All Filters” under the Account section and click on “ADD FILTER.”
Step-5 Here you put the name of your filter. You can choose a predefined option here, but if you want to exclude any Google ID or any city or include any dimension, add it into the filter. Selected the view, you have already made in step 2. Click the save button.
Step-6 Now you should go under the “View” and click on “Filters”, here you should make sure that you have the same filter here which you have created at the Account level. Also, make sure that you have selected the right view adjacent to Analytics at the left side corner.
From now, your data will be filtered for the future by Google Analytics. You should know that past data will not be filtered, but for the future, it will filter and show data here in this view. You can click and time on the left corner (adjacent to the Analytics left corner) and select the view from there to see this data. You should also be aware that your all website data will be raw data which will be available all the time with you.
Now adding this view, you can filter your data and can make the right decision for your business.
6.) Hour and Day Report to analyse what time you have users at your site
A smart marketer knows to create the custom report for day and time to analyse the users’ activity. He can schedule the campaigns as per the users day and time. Here it also helps the marketer to analyze the non-digital and digital campaigns that what time there is the highest conversion, which campaign helps to get higher conversions. And what time and day users are most top.
It can help the marketer to understand users availability and the campaign impact on site.
If you want to get this hour and day of week report in your main menu, it is tough and hard to navigate as well. For getting this type of report easy, you have to make little customization which is quickly you can have.
How to create this report
There are two ways to generate the report
A.If you don’t want to have any idea about how to create such a report. You go to Google Analytics Solution Gallary and get any time and days of week related report and import it into your custom report tab in the customization section of the main menu bar.
B.If you want to create this type of report follow the following steps
Step-1 Go to Customization section of your main menu and click on it now you see “Custom Report” option
Step-2 Click on it and you will be no report here but have an option which says “+New Custom Report.”
Step-3 You get a window saying Title, you can title any by which you can recognize your report. Now name your report tab again it is for recognition. Add the type you should take it Explore. Now the critical part comes to choose the Metric Group, here you can select multiple metrics, but you should select only users. Then go to Dimensions here choose Hour and Day of Week Name. Go below and choose the view in which you want to implement this report.
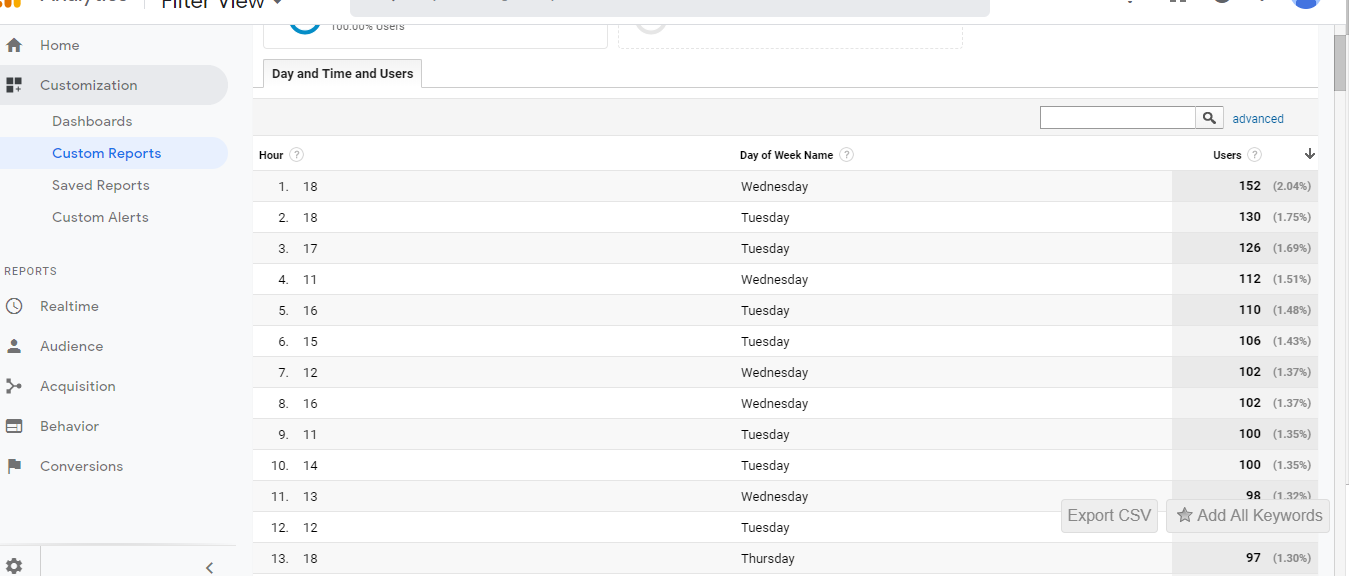
Step-4 Now click on say button and your report will be ready like below.
Image
Now you can see the hours on 1 to 24 period and days of the week with user metric. More user you have on a particular day and time shows that you have higher chances of business so you can publish your content at this time. You can conclude any campaign here.
There are lots of other ways to understand Google Analytics data. Utilize this information to make the business decision, content improvement, SEO optimization, and budget allocation and many more.
As we have mentioned Google analytics is a powerful tool for your business.
Why Google Analytics Makes Perfect Sense for Intelligent Marketers
Our objective is to make complex Google Analytics simple for which you don’t need any excellent technical skills or deep data science experience. If you want to make your decision data-driven with the help of google analytics, then you can easily do that. You can quickly expand your Google Analytics skillsets; this is a great way forward.
With the above mention tips, you can easily make your decision perfect and can create the right mix of error-free data and get critical insights to have innovative marketing campaigns.
Google Analytics can be quite insightful and straightforward once you get started. Here are lots of other natural ways to analyse the data. Like You can check the mobile-friendly ness of your website. Behaviour flow at your site, adding different conversion types, Acquisition, Google Ads and webmaster data integration, search queries and keyword research, audience demographics, psychographic, new users vs returning users, site speed and suggestions and many more.
We will discuss Google analytics in our upcoming articles and will educate you about every dimension and metric of Google analytics. That can help you to grow your business. A Good marketer must have the right.


Amazing blog it is thankyou for sharing such a wonderful post.